4.3.3 Graded colour scheme - LUPMISManual
Main menu:
- 0. Introduction
- 1. GIS handling
-
2. GIS data entry
- 2.1 Create new layer
- 2.2 Digitize line
- 2.3 Digitize point
- 2.4 Digitize polygon
- 2.5 Edit existing layer
- 2.6 Delete feature
- 2.7 Split line
- 2.8 Split polygon
- 2.9 Merge lines from different layers
- 2.10 Unite lines
- 2.11 Snap lines
- 2.12 Join polygons
- 2.13 Extend polygon
- 2.14 Insert island
- 2.15 Define unit surrounding islands
- 2.16 Create 'doughnut'
- 2.17 Fill 'doughnut' polygon
- 2.18 Fill polygon with 'holes'
- 2.19 Digitize parcels from sector layout
-
3. GIS operations
- 3.1 Create buffer
- 3.2 Create exclusion zone
- 3.3 Overlay units
- 3.4 Convert line to polygon
- 3.5 Derive statistics (area size, length)
- 3.6 Clip unit according to other unit
- 3.7 Create geographic grid
- 3.8 Move entire vector map
- 3.9 Move or copy individual features on a map
- 3.10 Adjust polygon to line
- 3.11 Convert points to polygon
- 3.12 Define by distance
- 3.13 Create multiple objects
- 3.14 Transfer styles from one layer to another
-
4. Attribute database
- 4.1 Start with database
- 4.2 Import database
- 4.3 Display database information
- 4.4 Enter attribute data
- 4.5 Attribute matrix of multiple layers
- 4.6 Seeds
- 4.7 Repair attribute data
- 4.8 Merge lines with attached database
- 4.9 Transfer attribute data from points to polygons
- 4.10 Copy styles, labels, attributes
-
5. Conversion of data
-
5.1 Points
- 5.1.1 Import list of points from text file
- 5.1.2 Import list of points from Excel file
- 5.1.3 Convert point coordinates between projections
- 5.1.4 Convert point coordinates from Ghana War Office (feet)
- 5.1.5 Convert point coordinates from Ghana Clark 1880 (feet)
- 5.1.6 Track with GPS
- 5.1.7 Download GPS track from Garmin
- 5.1.8 Download GPS track from PDA
- 5.1.9 Frequency analysis of points
- 5.2 Vector maps
- 5.3 Raster maps
-
5.4 Communication with other GIS programs
- 5.4.1 Import GIS data from SHP format
- 5.4.2 Import GIS data from E00 format
- 5.4.3 Import GIS data from AutoCAD
- 5.4.4 Export LUPMIS data to other programs
- 5.4.5 Export GIS to AutoCAD
- 5.4.6 Change a shape file to GPX
- 5.4.7 Transfer GIS data to other LUPMIS installations
- 5.4.8 Digitize lines in Google Earth
- 5.5 Terrain data
- 5.6 Export to tables
- 5.7 Density map
-
5.1 Points
-
6. Presentation
- 6.1 Labels
- 6.2 Styles and Symbols
- 6.3 Marginalia
- 6.4 Legend
- 6.5 Map template
- 6.6 Final print
- 6.7 Print to file
- 6.8 3D visualization
- 6.9 External display of features
- 6.10 Google
-
7. GIS for land use planning
- 7.1 Introduction to land use planning
- 7.2 Land use mapping for Structure Plan
- 7.3 Detail mapping for Local Plan
- 7.4 Framework
- 7.5 Structure Plan
- 7.6 Local Plan
- 7.7 Follow-up plans from Local Plan
- 7.8 Land evaluation
-
8. LUPMIS Tools
- 8.1 General
-
8.2 Drawing Tools
- 8.2.1 Overview
- 8.2.2 UPN
- 8.2.3 Streetname + housenumbers
- 8.2.4 Lines
- 8.2.5 Arcs
- 8.2.6 Polygons
- 8.2.7 Points
- 8.2.8 Cut line
- 8.2.9 Other Drawing Tools
- 8.2.10 Import
- 8.2.11 Projections + conversions
- 8.2.12 Format conversion
- 8.2.13 Other GIS Tools
- 8.2.14 Utilities
- 8.3 Printing Tools
- 8.4 Permit Tools
- 8.5 Census Tools
-
8.6 Revenue Tools
- 8.6.1 Overview
- 8.6.2 Entry of revenue data
- 8.6.3 Retrieval of revenue data
- 8.6.4 Revenue maps
- 8.6.5 Other revenue tools
- 8.7 Reports Tools
- 8.8 Project Tools
- 8.9 Settings
-
9. Databases
- 9.1 Permit Database
-
9.2 Plans
- 9.2.1 Accra
- 9.2.2 Kasoa
- 9.2.3 Dodowa
- 9.2.4 Sekondi-Takoradi
-
9.3 Census Database
-
9.4 Revenue Database
-
9.5 Report Database
-
9.6 Project Database
- 9.7 Address Database
-
Annexes 1-10
- A1. LUPMIS setup
- A2. Background to cartography/raster images
- A3. Glosssary
- A4. Troubleshooting
- A5. Styles
- A6. Classification for landuse mapping/planning
- A7. GIS utilities
- A8. Map projection parameters
- A9. Regions / Districts
- A 10. Standards
-
Annexes 11-20
- A11. LUPMIS distribution
- A12. Garmin GPS
- A13. Training
- A14. ArcView
- A15. Population statistics
- A16. Entry and display of survey data
- A17. External exercises
- A18. Programming
- A19. Paper sizes
- A20. Various IT advices
- A21. Site map and references
4.3.3 Graded colour scheme
You can display the map with graded colours for the specified data field.
Back to the Project manager window: Style > Assign according to > Database > Data column > Select the data field you want for display (here: MATMORT) > Filter data in ... >
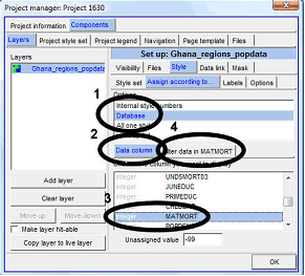
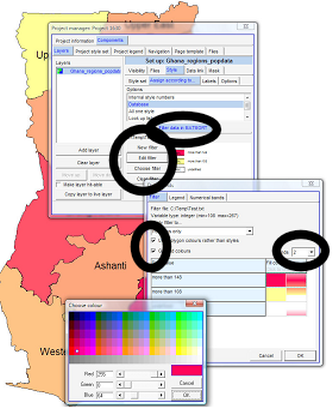
> New filter > Select folder > Specify a new file name for the filter (= colour grade definition, which you will create now, e.g. 'filter1') > Save (If you have created such a filter before, you can ‘Choose filter’) > OK >
> Data bands window: Filter > Apply filter to: Polygons only > Tick: ‘Use polygons colours rather than styles’> Tick: ‘Graded colours’ > Bands: 2 > Click on the gray/colour boxes below ‘Fill colour’ to select the colour range (recommended: Dark colour for the upper box, light colour for the lower box) > OK > OK
Note 1: In specific cases, you might use also 3 bands with an intermediate colour.
Note 2: If ‘graded colour’ is not visible or is not enabled, you have to check and make sure, that the numbers for the gradient are numeric, in the original spreadsheet.
The graded colours map should look like this:
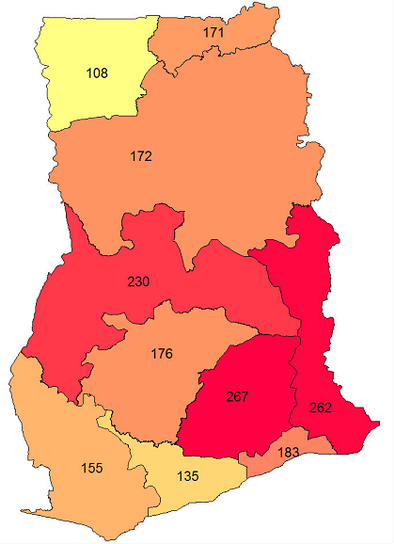
- - - - -
If you want the colour scheme not graded, but assign individual colours, you can do so: Remove the tick from ‘Graded colours’ > Check or assign individual colours > Test different options with different bands:
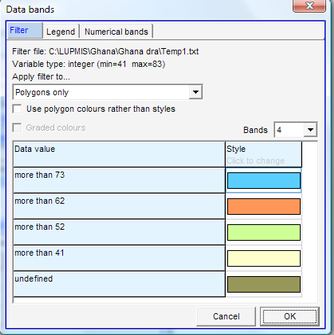
- - - - -
If you work with individual colour assignments for different classes, you might be interested in the definition of the bands, i.e. the assignment of colours to numeric values of the database. You find these under ‘Numerical bands’(1, see below).
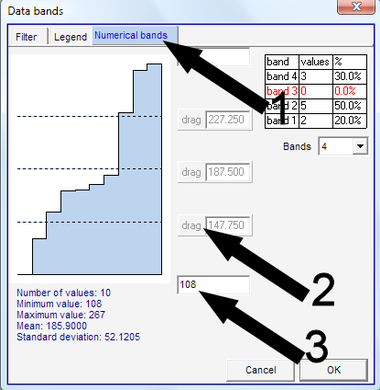
You can change the band limits by clicking on the ‘drag’ button and drag it up or down (2).
If you the lower limit does not show correctly on your map, you should reduce the lower limit by 1 (3).
Note 3: It is always what is displayed under this ‘Numerical bands’, not under ‘Filter’, what is then used for the calculation of the map.