7.2.2 Process of land use mapping - LUPMISManual
Main menu:
7.2.2 Process of Land Use Mapping
Level of expertise required for this Chapter: Intermediate; specifically for LUPMIS @ TCPD
In Map Maker, have the background of the same map, and be ready in live layer mode to digitize polygons. With the hand-drawn draft map next to you, trace the polygons in Map Maker.
Consider all tools, which you learned in earlier sessions, such as Polygon-tool, Cutter-tool, Join-tool, Snap-tool, island handling etc (see Chapters 2.5 - 2.16). Many of them are displayed on the toolbar left.
It is recommended, to zoom in and out frequently, to see the details, but not to loose the overview. A good working screen scale for digitizing (bottom left at the Map Maker screen) is 200 m in built-up land, 500 m in other areas.
1. Load the classification (classes) for the land use map (style library LandUse_tl, see Annex 6.1.
- - - - -
2. Start with medium-size units. Leave small details and very large units to later (see steps 3 and 4 respectively).
- 2.1 The first units to digitize are those, which can easily be identified, such as flood areas, factories, bad land, transport corridors (if large enough), forests, markets, small villages etc.
- 2.2 Later, map high-density residential and commercial areas.
- 2.3 The most difficult part is where areas don’t have a distinct boundary, but a wide transition zone. (For example, between high and low density residential areas, or between scattered residential areas and agricultural land).
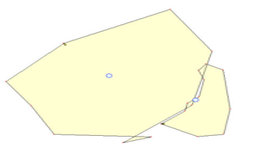
Be sure, you always ‘snap’ (with a snapping distance of a few meters only), and that you don’t have any ‘slivers’ or overlaps, like this:
Save frequently in always new temporary files, such as ‘Kasoa_landuse_01’, ‘Kasoa_landuse_02’ etc.
- - - - -
3. After the main units of medium size have been digitized, small distinct features, which are important for land use planning, have to be identified. They often form ‘islands’ (see Chapters 2.14 and 2.15).
Do not enter too many of them, as this will not contribute to an easy understanding of the map.
Do not map individual houses or even built-up functionalities, such as post office, bank etc at this stage. This can be mapped, if necessary, through the process of 'detail mapping' for Local Plans (see Chapter 7.3).
- - - - -
4. At the end, handle the largest unit(s), often surrounding all the other units. (For example, agricultural land around a village in a rural area).
This process is more complex, and therefore described here in more detail.
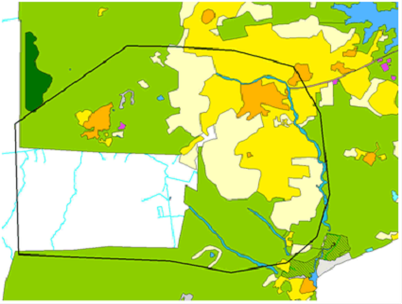
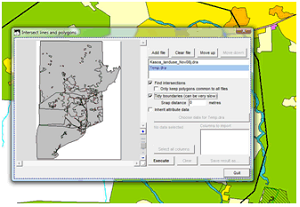
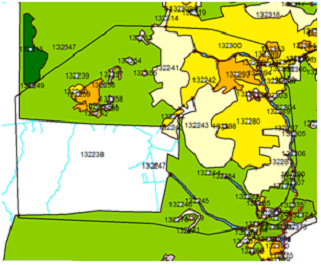
- 4.1 With the latest version of the land use map in a static layer (i.e. not live layer), draw a large polygon well around the area, which is not covered yet. (See the black line at the example below). Save it in a temporary file (‘Temp’).
- 4.2 Intersect the two layers to come up with one ‘fill-polygon’:
Main menu > Utilities > Vector utilities > Intersect/Unite files > Intersect lines and polygons window: Add file > Select folder and file name of intermediate land use map (in colours in this example) > Open > Again: Add file > Select folder and file name of file with ‘fill-polygon’ (in black outline in this example, proposed name ‘Temp’) > Open >
Tick ‘Find intersections’ > Tick ‘Tidy boundaries’ > Leave others unticked > Execute > ..will take some time… > Save result as… > Specify new file name (for example, ‘Temp1’) > Save > Quit
- 4.3 Load this layer into the live layer:
Main menu > Edit > Load file into live layer > Select folder and file (in this example, ‘Temp1’) > Open >
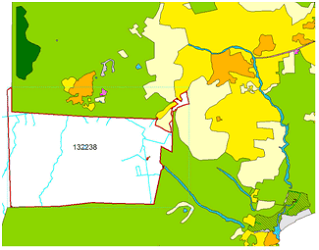
This layer in live layer mode has a lot of individual polygons. Delete them all, except the one, which covers the area, which is so far not covered by the land use map (in the example below, unit 132238).
You can delete them by: Main menu > Edit > Select all > Select-tool (at toolbar left) > Press Shift and select the one unit, which is not to be selected > Delete
- 4.4 Copy-paste this one ‘fill-polygon’ to your intermediate land use map:
Main menu > Edit > Copy
Main menu > Edit > Clear live layer
Copy your intermediate land use map into the live layer: Main menu > Edit > Paste
You have now merged the intermediate land use map with the ‘fill-polygon’ of the surrounding area.
- 4.5 If you have more than one of these ‘surrounding’, fill areas, you have to repeat this step 4 accordingly.
Alternatively, you can also use one large ‘fill-polygon’ all around the earlier digitized mapped land use polygons.
- - - -
Note: In case your style numbers are not transferred after the ‘intersect/unite process’, you have to go through following procedure:
1. From your digitized land use polygons, extract style information to seeds: Right-mouse click > Live layer actions > Live layer actions window: Basic operations > Create seed points from polygons > OK > right-mouse click > Save live layer as ... > Save as window: Specify file name > OK
2. Proceed the process of ‘intersect/unite’ (4.2 above).
3. ‘Re-import’ the styles into the overlay file: Load the overlay file into the live layer, then right-mouse click > Live layer actions > Live layer actions window: Spatial queries > Polygons inherit attributes from seed points > OK > Polygons inherit attributes from seed points window: Seeds file > Select file of step 1 > Open > ‘Discard unseeded polygons’ should be un-ticked > OK
4. Check the map, particularly the units at the edge of the ‘fill-polygon’. You might have to enter styles at split units at the edge (through ‘Edit’).
- - - -
5. Don’t forget to assign a style to the surrounding area(s), maybe to join
- - - - -
6. Don’t forget to save.
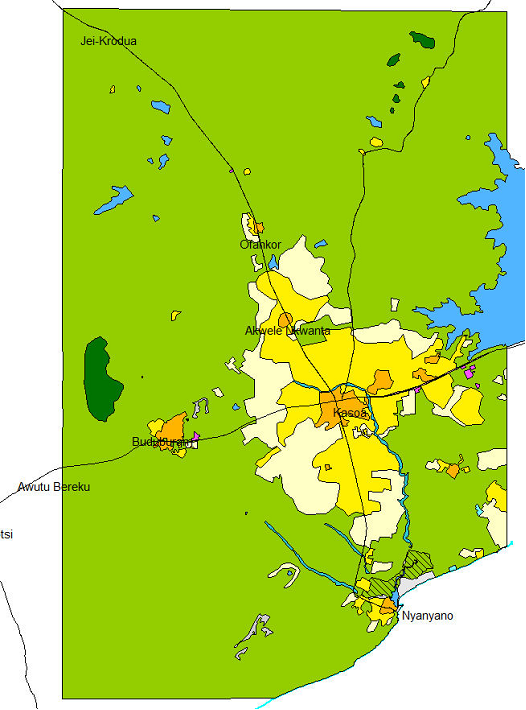
The sample map below demonstrates the basic features of a land use map, here of the Kasoa planning area. The actual land use map of this area is more complex (and has marginalia and legend, see Chapter 7.2.3).