7.4.2 Workplan for Framework - LUPMISManual
Main menu:
7.4.2 Workplan for Framework
Level of expertise required for this Chapter: Planner; specifically for LUPMIS @ TCPD
1. Preparation
1.1 Collect basic GIS data:
Major towns
Major roads, which will serve as development corridors
General topographic maps
Hydrology (rivers), if a major river forms a development corridor
etc
1.2 Have the base map of the approximate area of the Framework area ready in LUPMIS, in WGS84 coordinate system.
1.3 Agree on planning area of Framework, based on maps and consideration of development trends and known major proposals. (In most cases, this will be the district. Only in exceptional cases, the Framework will extend beyond the district boundary).
1.4 Calculate scale. In most cases, this will be around 1:100,000, but might be as small as 1:250,000. Target is to have a good overview on a not too large map (preferably, A2).
1.5 Collect, read and incorporate Medium Term Development Plan (MTDP): List development objectives of MTDP for all concerned districts. Mark all points of development, which can be geographically related.
1.6 Discuss this workplan with your colleagues. Assign a timeframe for each step and individual responsibilities.
2. Data Collection – Part 1
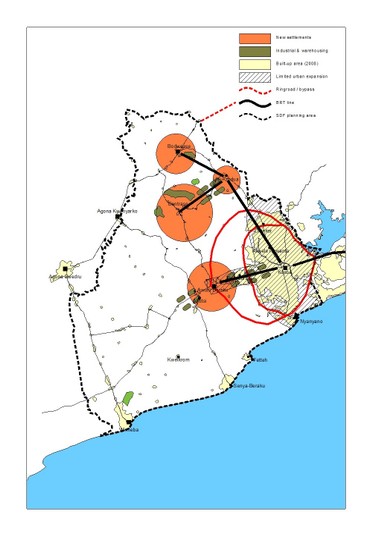
2.1 Identify present and future population of urban areas within Framework area. Assess their growth rates, based on census data, and put them in form of different size circles on the base map (see step 1 of the following lt Chapter 7.4.3for example and Annex 15for statistics and more examples).
2.2 Identify functions of each urban area:
Administrative area
Dormitory town
Market town
District hospital
Tertiary educational centre
Tourism
Military
Business centre
Stadium
etc
Note, it can be more than one. These functionalities can be documented in form of a matrix (table, 'town functionality matrix' or 'scalogram', for example in MS Excel, in quantitative terms).
Differentiate between current functionalities and – more important for the planning process - proposed, planned future functionalities.
You can use the data chart tool of Map Maker (see Chapter 4.3.4) or different coloured pie charts or circles on the map to visualize them in LUPMIS. This information can be presented:
In the main Framework map, or
As a small inset map in the Framework map, or
As an additional map in the Framework plan.
See also steps 5 and 6 of the following Chapter 7.4.3.
2.3 Identify main sources of employment for the population of each area and visualize them in a similar way, for example, with different colours or sizes circles.
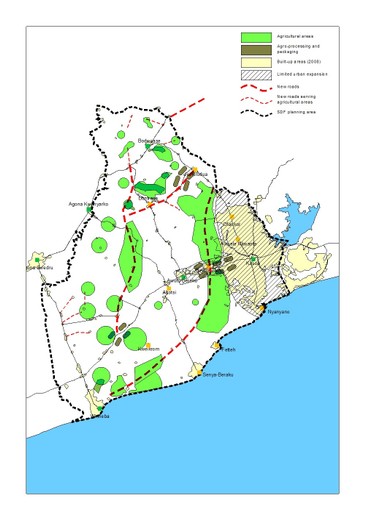
2.4 Identify actual or potential agricultural areas by type:
Irrigated rice
Cereals – not irrigated
Vegetables
Tree crops or plantations
Livestock
Mixture of above
Put this information on the base map (see step 2.2 above) in LUPMIS. This can also be done in form of triangles, squares or similar symbols.
2.5 Identify appropriate boundaries of:
Watershed area
Forest areas
Protection areas
Reserved areas
Wetland areas
Areas with striking features such as hills/cliffs
etc
Put this information on the base map, similar to step 2.4 above. (See also step 3 of the following Chapter 7.4.3.
2.6 Identify location of historic or culturally important sites and put this information on the base map.
2.7 Identify areas with potential for tourism such as unspoiled beaches and areas, where tourism is already developed, and put this information on the base map.
2.8 Identify main transport patterns using MTDP and data from Ministry of Transport, Department of Highways:
Commuter traffic
Through traffic
Traffic generated by markets
etc.
Alternative is measurement of traffic volume on specified routes.
You can use buffers or line width option of Map Maker on tracked roads for visualization. Again, this information can be presented in different map versions (as listed under step 2.2 above, see also step 4 of the following Chapter 7.4.3).
2.9 Organize discussions and/or workshop with key persons from Assemblies and Regional Coordinating Council, at which the compiled maps are shown and request to identify their vision and objectives of the development of the district.
2.10 Identify actions required to achieve these ‘visions’.
3. Data Collection – Part 2
3.1 Identify existing plans of Assemblies:
Urban and feeder roads and plans
Land identified for specific uses, such as school campus, hospital site, market, transport depot, solid waste final disposal sites
etc.
Identify their location and status (is there an approved plan, budget, an approved proposal, has land been designated or reserved?) and put them on the base map.
3.2 Identify existing plans from Highways Commission (with their location and status of plans, whether approved, time line for realization etc) and put them on the base map.
3.3 Identify existing agricultural development projects including areas subject to irrigation and main sources of water supply (with their location and status) and put them on the base map.
3.4 Identify existing public sector plans for:
Industry
Housing
Main drainage
Irrigation
Transportation
Mining
Tourism development
through respective departments, with their location and status of plans (whether approved, time line for realization etc) and put them on the base map.
3.5 Identify existing private sector plans for:
Industrial parks
Tourism and recreation complexes
Housing
Large scale retail development
Mining concessions
Telecommunications network coverage
etc
with their location and status of plans and put them on the base map.
3.6 Identify proposals for electricity and water distribution and waste disposal, and plans for increasing the capacity and extending their distribution (only main or trunk distribution lines, with capacity) with their location and status, and put them on the base map.
4. Analysis
4.1 Evaluate plans and identify contradictions between sector plans and gaps in development that need to be met:
Additional roads or improved roads
Extension of power and water supply
Activities that compete or contradict such as those that have detrimental environmental impact on tourism areas
Availability and accessibility of hospitals, tertiary education
etc.
Correct and update maps.
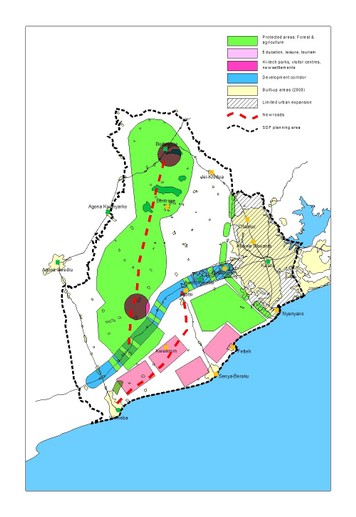
4.2 Prepare different scenarios to meet agreed overall ‘vision’ and list actions required to achieve these objectives, given the existing proposals identified earlier. Prepare diagrammatic representation of different alternatives in LUPMIS inform of maps with a combination of delineated mapping units and thematic symbols.
This is seen as the most important step of Framework-planning. A number of 2-4 different options is most adequate in most cases, and gives the decision makers the best choice of selection.
If no economic long-term framework has been prepared for the area in the Medium Term Development Plan (MTDP) and/or in the regional or national framework plans, this has to be defined now.
Different economic development options (preferably with spatial background) will have to be discussed. The options can be combined (option A and B and C) or exclude each other (thus carrying more the nature of a vision), either in the entire area or in parts of it.
For example:
Option A: Focus on agriculture
Option B: Focus on urbanization and industrialization
Option C: Focus on 'green' ecology
The design of these scenarios can already be in the standard Framework layout (see Chapter 7.4.4).
4.3 Organize workshop for key persons from Assemblies, the RCC and representatives of key sector agencies (agriculture, public works, highways, health, education and utility companies). Clarify any contradictions in the existing policies, programmes and plans and identify gaps. Agree on how to resolve problems and of road ahead.
Present the different options of previous step 4.2 including pro and con of each proposal.
5. Plan Formulation and Presentation
5.1 Prepare revised version of spatial Framework reflecting preferred option.
5.2 Prepare report and map reflecting present situation, vision and actions to be taken by each sector. This should also include the projected impact of the proposals on the population’s growth and distribution in each urban and urbanizing area, and actions required to preserve environmentally sensitive areas.
5.3 Prepare schedule for implementation by sector and identification of agency.
5.4 Prepare presentation for Framework approval by Assemblies.
5.5 Finalize and present report and maps.
5.6 Receive final approval of plan.